Skip to content
▶ Ready Set Printables
ActivitiesWorksheetsBy AgeSearch
Home › Worksheets › Science Worksheets › Data Recording Tables

Data Recording Tables

Free printable data recording tables as PDFs. Blank results tables for experiments, with headers and repeat-trial columns. No sign-up.

⬇ Download all 3 as one PDF — free, no sign-up

A results table drawn freehand mid-experiment is always too small, always missing a column for the second trial, and always redrawn once the numbers start arriving. These blank tables solve that by giving you the structure before you begin: labeled header cells for the variable and its units, rows for each value tested, and repeat columns so trials can be averaged. Deciding what goes in the columns before the experiment starts is also, quietly, a way of making students plan properly.

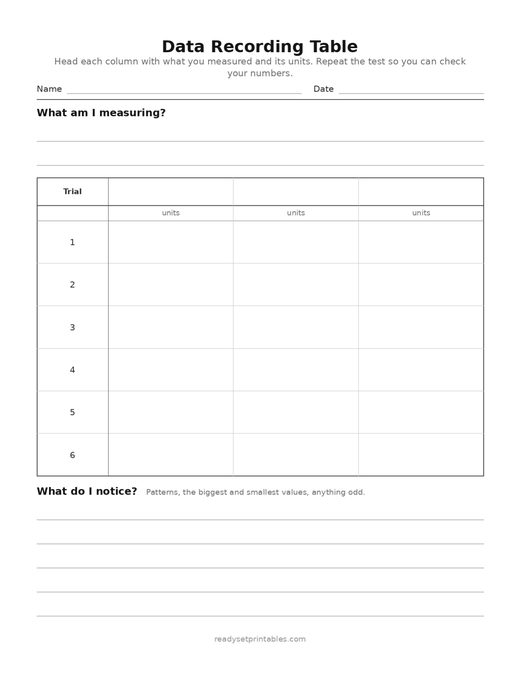
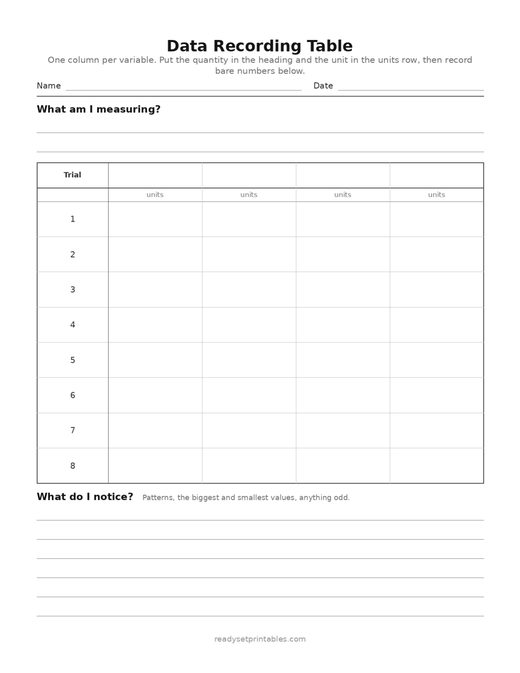
Blank data tables in several shapes — two-column tables for simple paired readings, and wider tables with three repeat-trial columns plus an average column. Header cells are left blank so you can write in your own variable names and units. Row counts vary between sheets to suit short and long investigations. Black and white, US Letter.
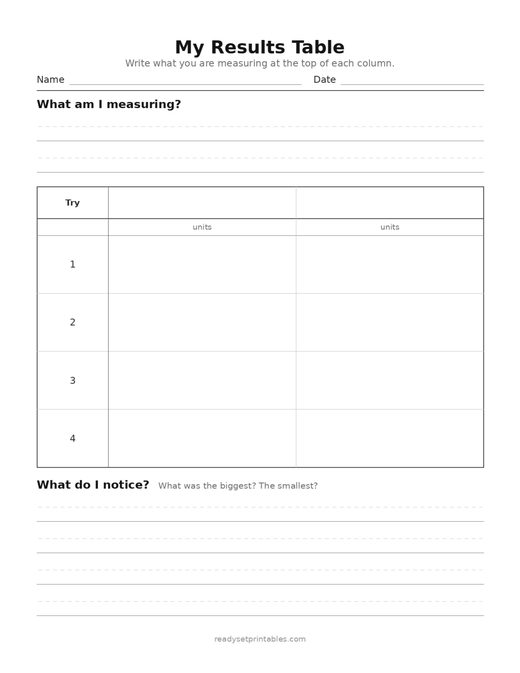
my results table — template (ages 5–7) — free printable science worksheet My Results Table — Template (Ages 5–7)Download PDF ↓ data recording table — template (ages 8–10) — free printable science worksheet Data Recording Table — Template (Ages 8–10)Download PDF ↓ data recording table — template (ages 11–14) — free printable science worksheet Data Recording Table — Template (Ages 11–14)Download PDF ↓
Related printables

Animals WorksheetsScience WorksheetsEarth and Space WorksheetsElectricity and Magnets WorksheetsScience Worksheets

Frequently asked questions

What should go in the header row of a results table?
The name of the variable and its unit, written once in the header rather than repeated beside every number — for example Length (cm), not 12 cm in each cell. Keeping units out of the body of the table is a standard convention and makes the numbers far easier to read and graph.
Why include columns for repeat trials?
Because a single reading cannot tell you whether a result is reliable. Running three trials and averaging them shows whether your measurements agree with each other, and a wildly different third reading is a signal to check the method rather than to record it and move on.
Which column goes on the left?
Conventionally the independent variable — the thing you changed — goes in the first column, with the dependent variable measured against it to the right. That ordering matches how the data will later be plotted, with the independent variable on the horizontal axis.
Can these be used for math as well as science?
Yes. The same blank tables work for tallying survey responses, recording measurements in a math lesson, or collecting data before making a bar chart. Nothing on them is specific to science apart from the repeat-trial framing.

Enjoying these free printables?

Ready Set Printables is a free resource with no ads and nothing to buy. If you teach or are helping a child revise, you might also like AI Study Method — free interactive revision games and study tools.

ActivitiesWorksheets By AgeSearchAbout

© 2026 Ready Set Printables. Free to print for home and classroom use. Please don’t re-sell or re-host the files.